
Reading & Statistics
I don't like math, but I do like tracking my reading statistics. It's one of the only times I find numbers interesting enough to make it part of my daily life. Something about the numbers, pie charts, and bar graphs make me happy and motivates me to read more.
In January 2018, I took Problem Solving with Computers as an easy cop-out for my math credit. Of everything I learned there, I loved the spreadsheet the most. Learning about Excel spreadsheets was intended to help us create budgets or weekly schedules, but I decided to use it as a reading tracker instead.
After class one day, I looked into other peoples' reading spreadsheets online and came up with my own. Since 2018, it has evolved quite a bit and I might have finally gotten to the perfect system for me.
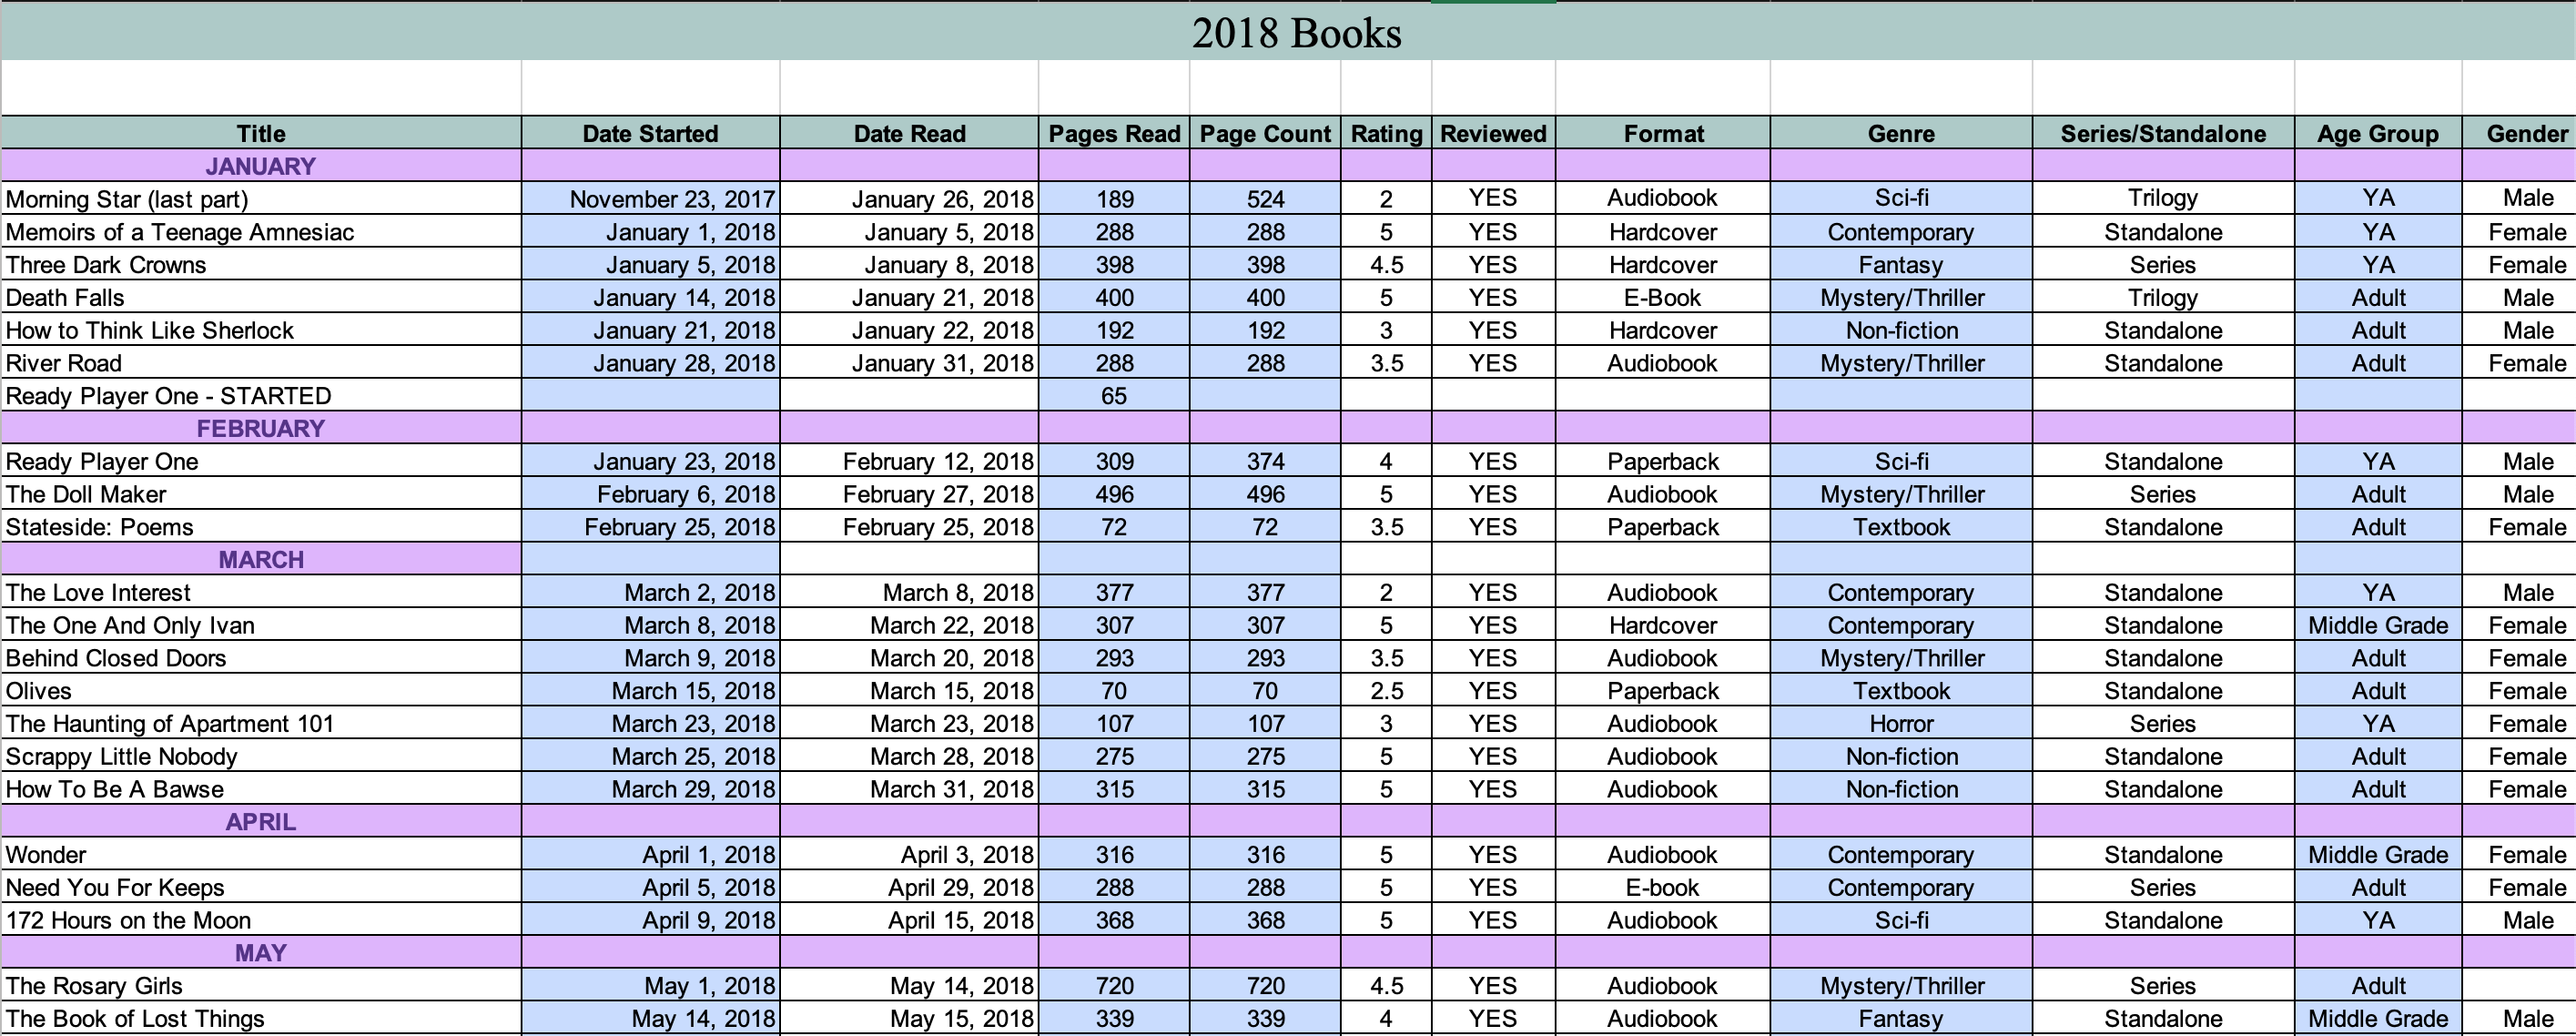
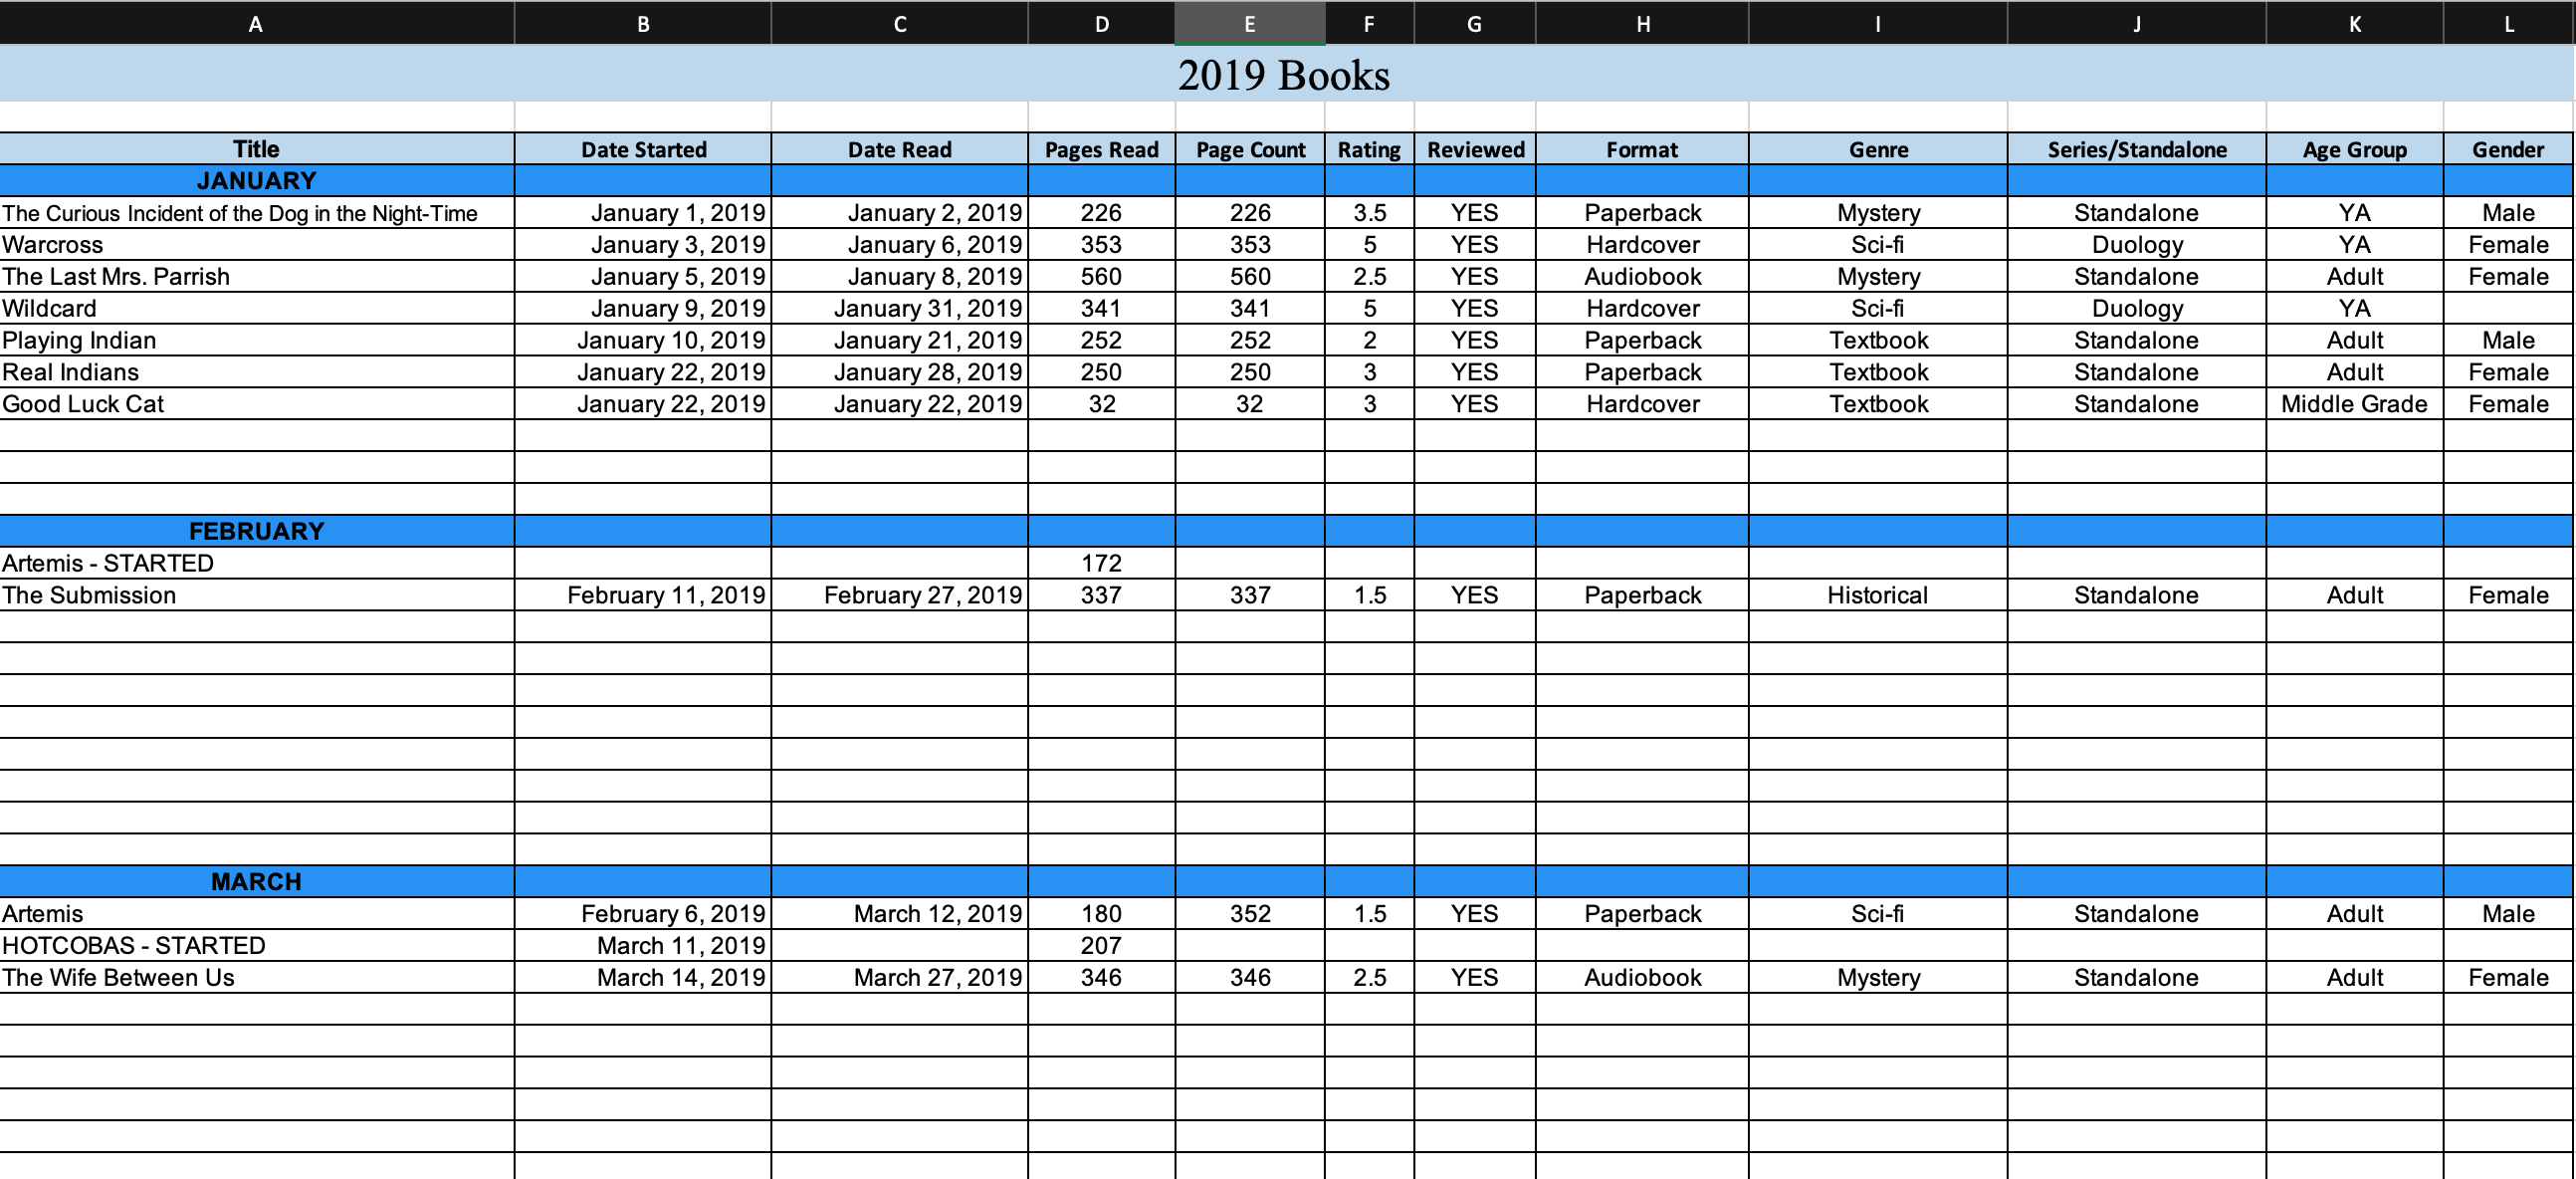
The spreadsheet has space for ten books per month, which is the most I am likely to read in any given month. I note down my start and end dates for each book, as well as the number of pages and my rating. The book's genre, format, age group, and author gender are also written down.
In 2018 and 2019, I had a column that told me if I had reviewed a book for this blog or not. It was a good reminder when I got off-track with writing reviews, but I quickly fell so far behind that I left out that column when I created my 2020 tracker.

Now, why do I like this? It's honestly a lot of fun for me to look at my stats each month and at the end of each year. I can see what genres I read most, if I read more from men or women, or how many pages I average each month. Seeing how each month varies allows me to better understand my own reading, and it's something I find fascinating.
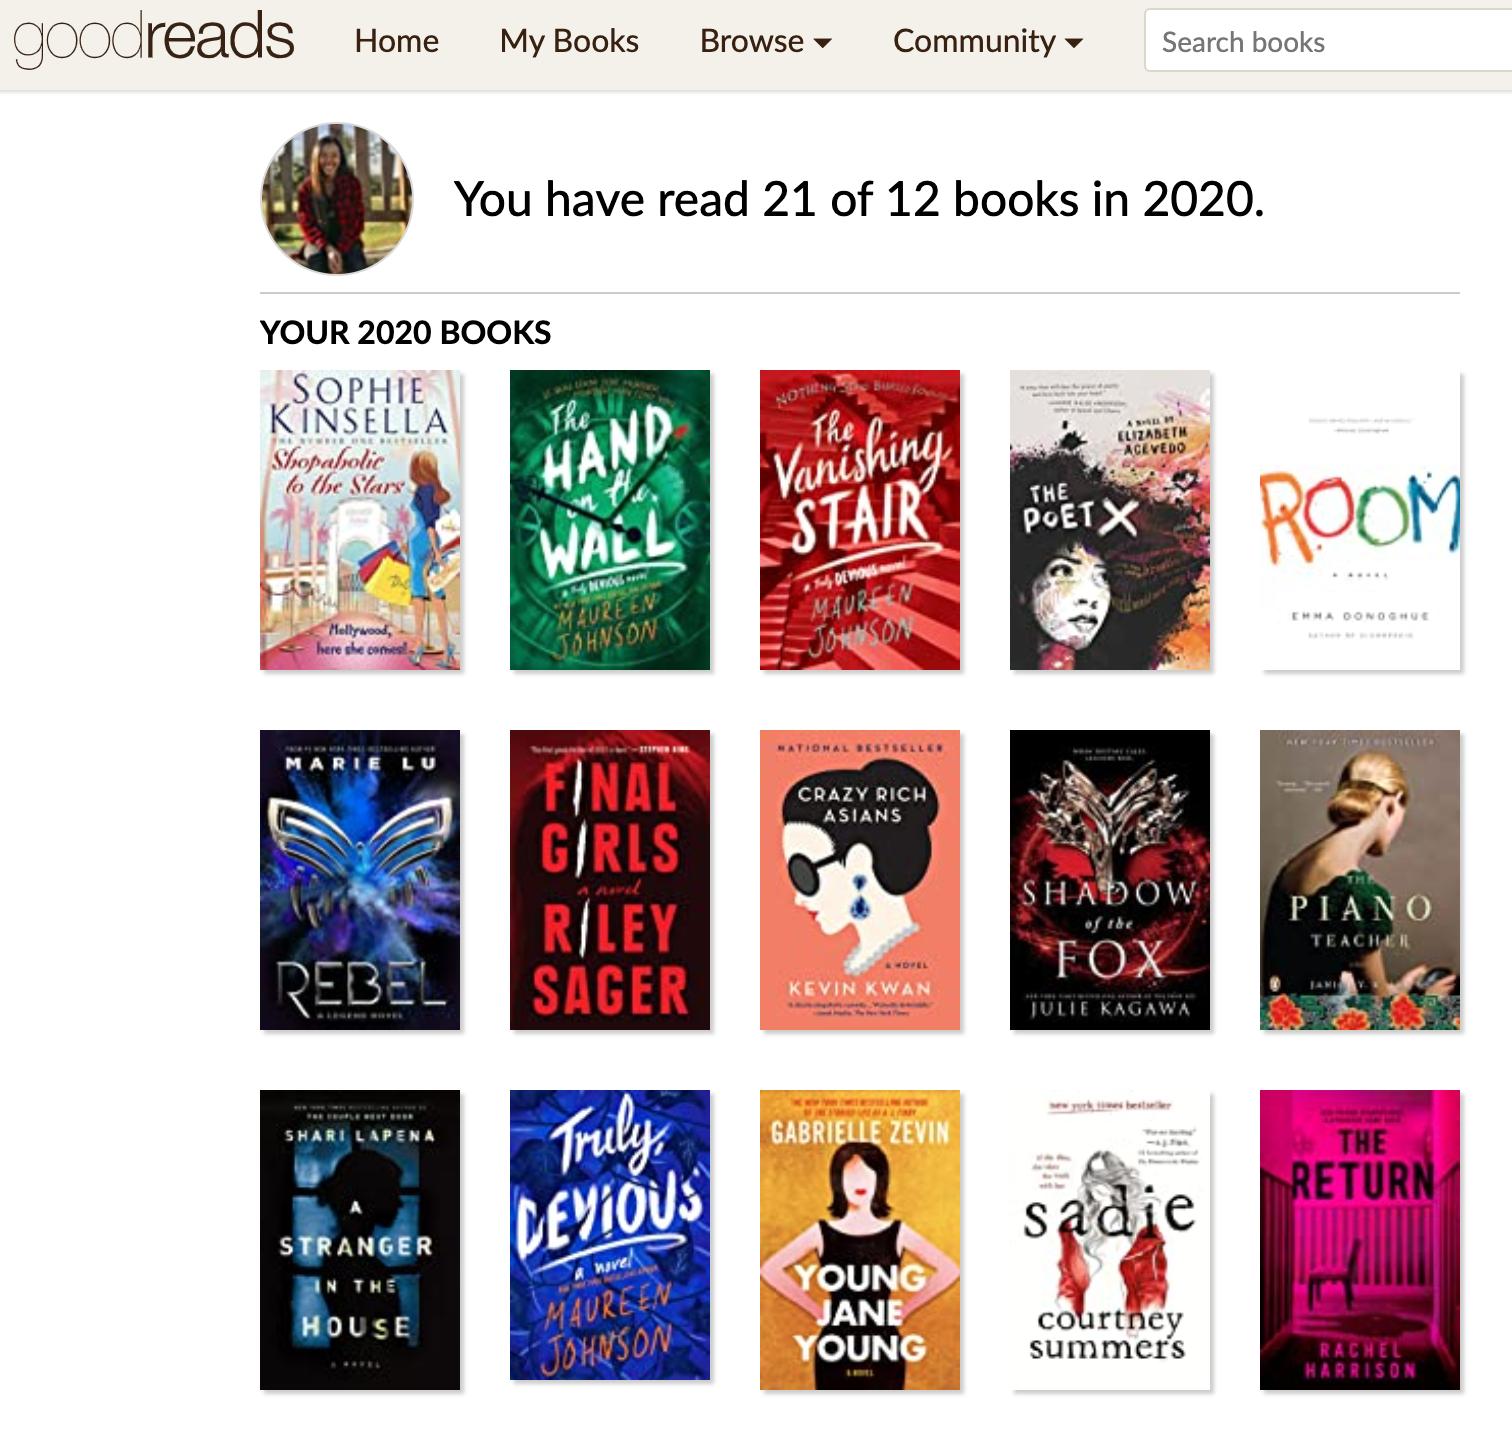
As a result, I enjoy finding more and more ways to track my reading. For years, I only used Goodreads to track my reading. It gives me a really great look at my annual reading and easily allows me to compare past years. It offers fun information like the most popular book I read each year, the longest book, and the highest rated book. That, combined with the Goodreads challenge and being a social media site, makes it one of the most convenient places in which I track my reading. However, I wanted something more in-depth and more on the month-to-month basis. It was easy, but it didn't offer all the things I wanted.
When I created my spreadsheet, it was finally the perfect way for me to get all the statistics I wanted. I can see how many books and pages I've read each month, which is one of the most interesting and encouraging things for me. Seeing the numbers go up each time I complete a book is really satisfying. But, I can also change each spreadsheet to fit the things I want to track, like author gender and the format I read most. And because Goodreads doesn't allow for half-star ratings, my spreadsheet gives me a more accurate representation of what my actual ratings are at the end of the year.
When I started bullet journaling, I created a quarterly reading tracker. It worked for about a year, but then I forgot to update it and slowly, I abandoned that tracker. I've tried the bookshelf tracker, but that didn't work out too well for me either. I forgot to draw the books and then I just became lazy. Then, I tried tracking the number of pages I read each day, but that got too complicated on nights when I didn't update my tracker. So eventually, I settled for a monthly tracker with an estimate of how much time I spend reading each day. It's easy to track time for my physical books and WebToons. I can see how much time I spend on the WebToon app that contributes to this tracker, and I tend to read for at least 15 minutes each time I pick up my physical book.
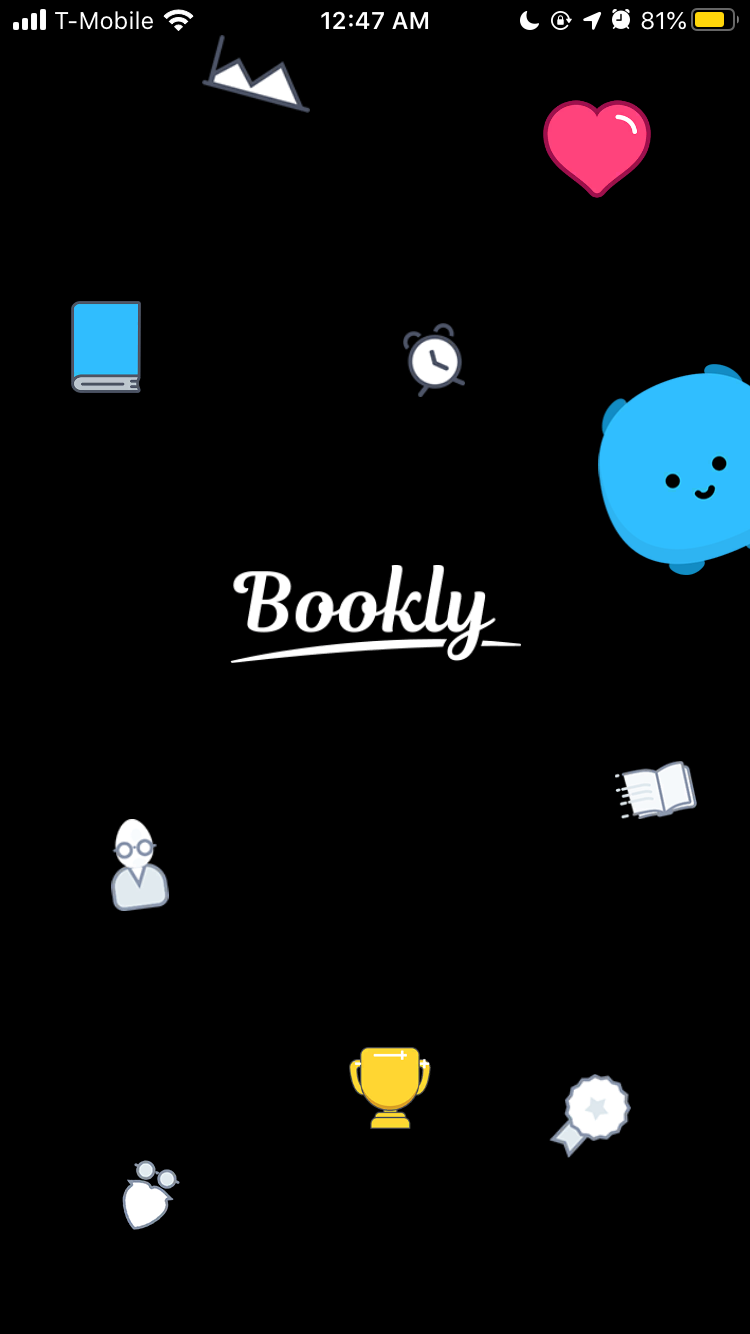
And most recently, I've decided to try using Bookly, a reading tracker app. I had tried it once before during my sophomore year of college, but at that point, it didn't appeal to me as much because the features I wanted were only available in the premium version. I decided to spend the money on an annual subscription to see if it would really push me to read more, mostly because it offers daily streaks and I'm a very competitive person. This app lets me time reading sessions that calculate how quickly I read, gives me stats at the end of each book, each month, and each year. The reading sessions also make it easy for my to update my bullet journal at the end of each day. Mostly, it's the infographics that make my nerd brain happy.
My love for these stats was only encouraged by Kayla from BooksandLala, a popular BookTuber, who shared how much she loved looking at her reading stats at the end of the year. She puts together long, in-depth videos at the end of each year about her stats and I love watching those videos. Not only does she make it visually appealing, she also analyzes her reading as she recounts the statistics. I think her end-of-year stats videos were one of the biggest pushes for more people in the community to record annual wrap-ups in the style too. In fact, any time someone uploads a video about their reading stats, I'm willing to sit in front of a screen for hours as I listen to them break down everything about the books they read that year. The only other BookTuber I know who has a crazy spreadsheet system is Caz from Little Book Owl. Her spreadsheet converts audiobook time into physical pages and different books in her spreadsheet work for readathons - I admire her for creating something so cool.

I think the thing that appeals to me most about tracking my reading is the information. While I'm not great at math, I do like seeing how it operates in my life. My favorite part about math in school was creating budgets because I got to play with the numbers and see things move around. It's the same for my reading.
Looking at my highest and lowest ratings during the year, seeing how many pages I average in a month, it's all a reflection of the months and the year. In the months when I read more, I like knowing what it was that motivated me. When I have reading slumps, I can see which books pulled me out. It's taking my reading and categorizing it in a variety of ways that all mean something different.
Though I know it's not for everyone, I think this is a major reflection of my personality. Having lists and charts and numbers that tell me more about myself and my reading is all part of my love of having information and records. My Type-A personality is thrilled to have all of this on record somewhere and I'm a sucker for a good infographic being presented to me or that I can create at the end of the month/year.
And at the end of the day, if all of this helps me to read more, then it's worth it.

2 comments